
Mean
Another significant number for a statistical series is its mean. We will limit our scope of study to the to the so-called arithmetic mean.
The arithmetic mean represents the common value all observations would have if the sum of the observations remained constant.
The arithmetic mean is noted ![]() , this number corresponds to the sum of the values of the series, divided by the number of values n.
, this number corresponds to the sum of the values of the series, divided by the number of values n.
Moyenne d'une série discrète.
In the case of a discrete series, the arithmetic mean is calculated as follows:
![]()
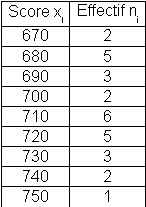
Using the data from the GMAT score example, the mean is 706.55
Let us now present the grades with their respective counts ni in an table:
For such a table, the mean formula will be:

Where k is the number of different values found in the series. The result is, of course identical, namely 706.55.
Moyenne d'une série continue.
Let us examine the case of a continuous series using the example of the headcount of industrial companies in France in 2009 (Industries manufacturières, industries extractives et autres, source Esane). These results are presented by intervals:
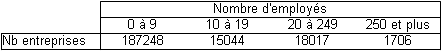
It is not possible to use the previous formula since we do not know what are the individual values for the xi.
Therefore we must choose a value for each class. We could decide to use the lower limit or the higher limit of each class however, arbitrarily, statisticians chose to use the arithmetic mean of the limits of each class, in other words, the center of the class.
Generally speaking, if the i class has the interval
![]() , we will choose the class value as:
, we will choose the class value as: ![]() .
.
We will then use the previous formula :
And present the results in the following table :
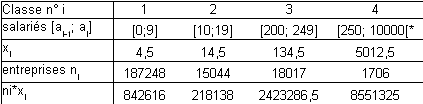
* : in order to calculate x4 we must postulate a finite value for the largest headcount. For this type of companies we arbitrarily chose 10,000 (any another educated guess of the largest headcount in this class is possible, do try and think about the error this decision will induce).
The mean is then ![]() , or around 54 (since we are always hesitant to have fractions of an employee).
, or around 54 (since we are always hesitant to have fractions of an employee).
Mode
The mode of a set of values is the value that is most represented within the set i.e. the value with the highest frequency.
According to this definition, it is possible to have a set without a mode, and when a mode does exist it may not be unique.
Let us consider the following examples:
Exemple :
Example A : 1, 1, 4, 6, 7, 7, 7, 8, 8, 9, 10, 10
Example B : 1, 2, 3, 4, 5, 6, 7, 9, 10
Example C : 1, 1, 4, 6, 7, 7, 7, 8, 8, 9, 10, 10, 10
In the series of example 1.4 the mode is 7.
In the series of example 1.5 there is no mode.
In the series of example 1.6 there are two modes, 7 and 10.
When there is only one mode, the distribution is called unimodal.
When data are grouped by classes, the class with the highest count is called modal class.


